Solar Shading Apparatus
Visualizing Home Shading
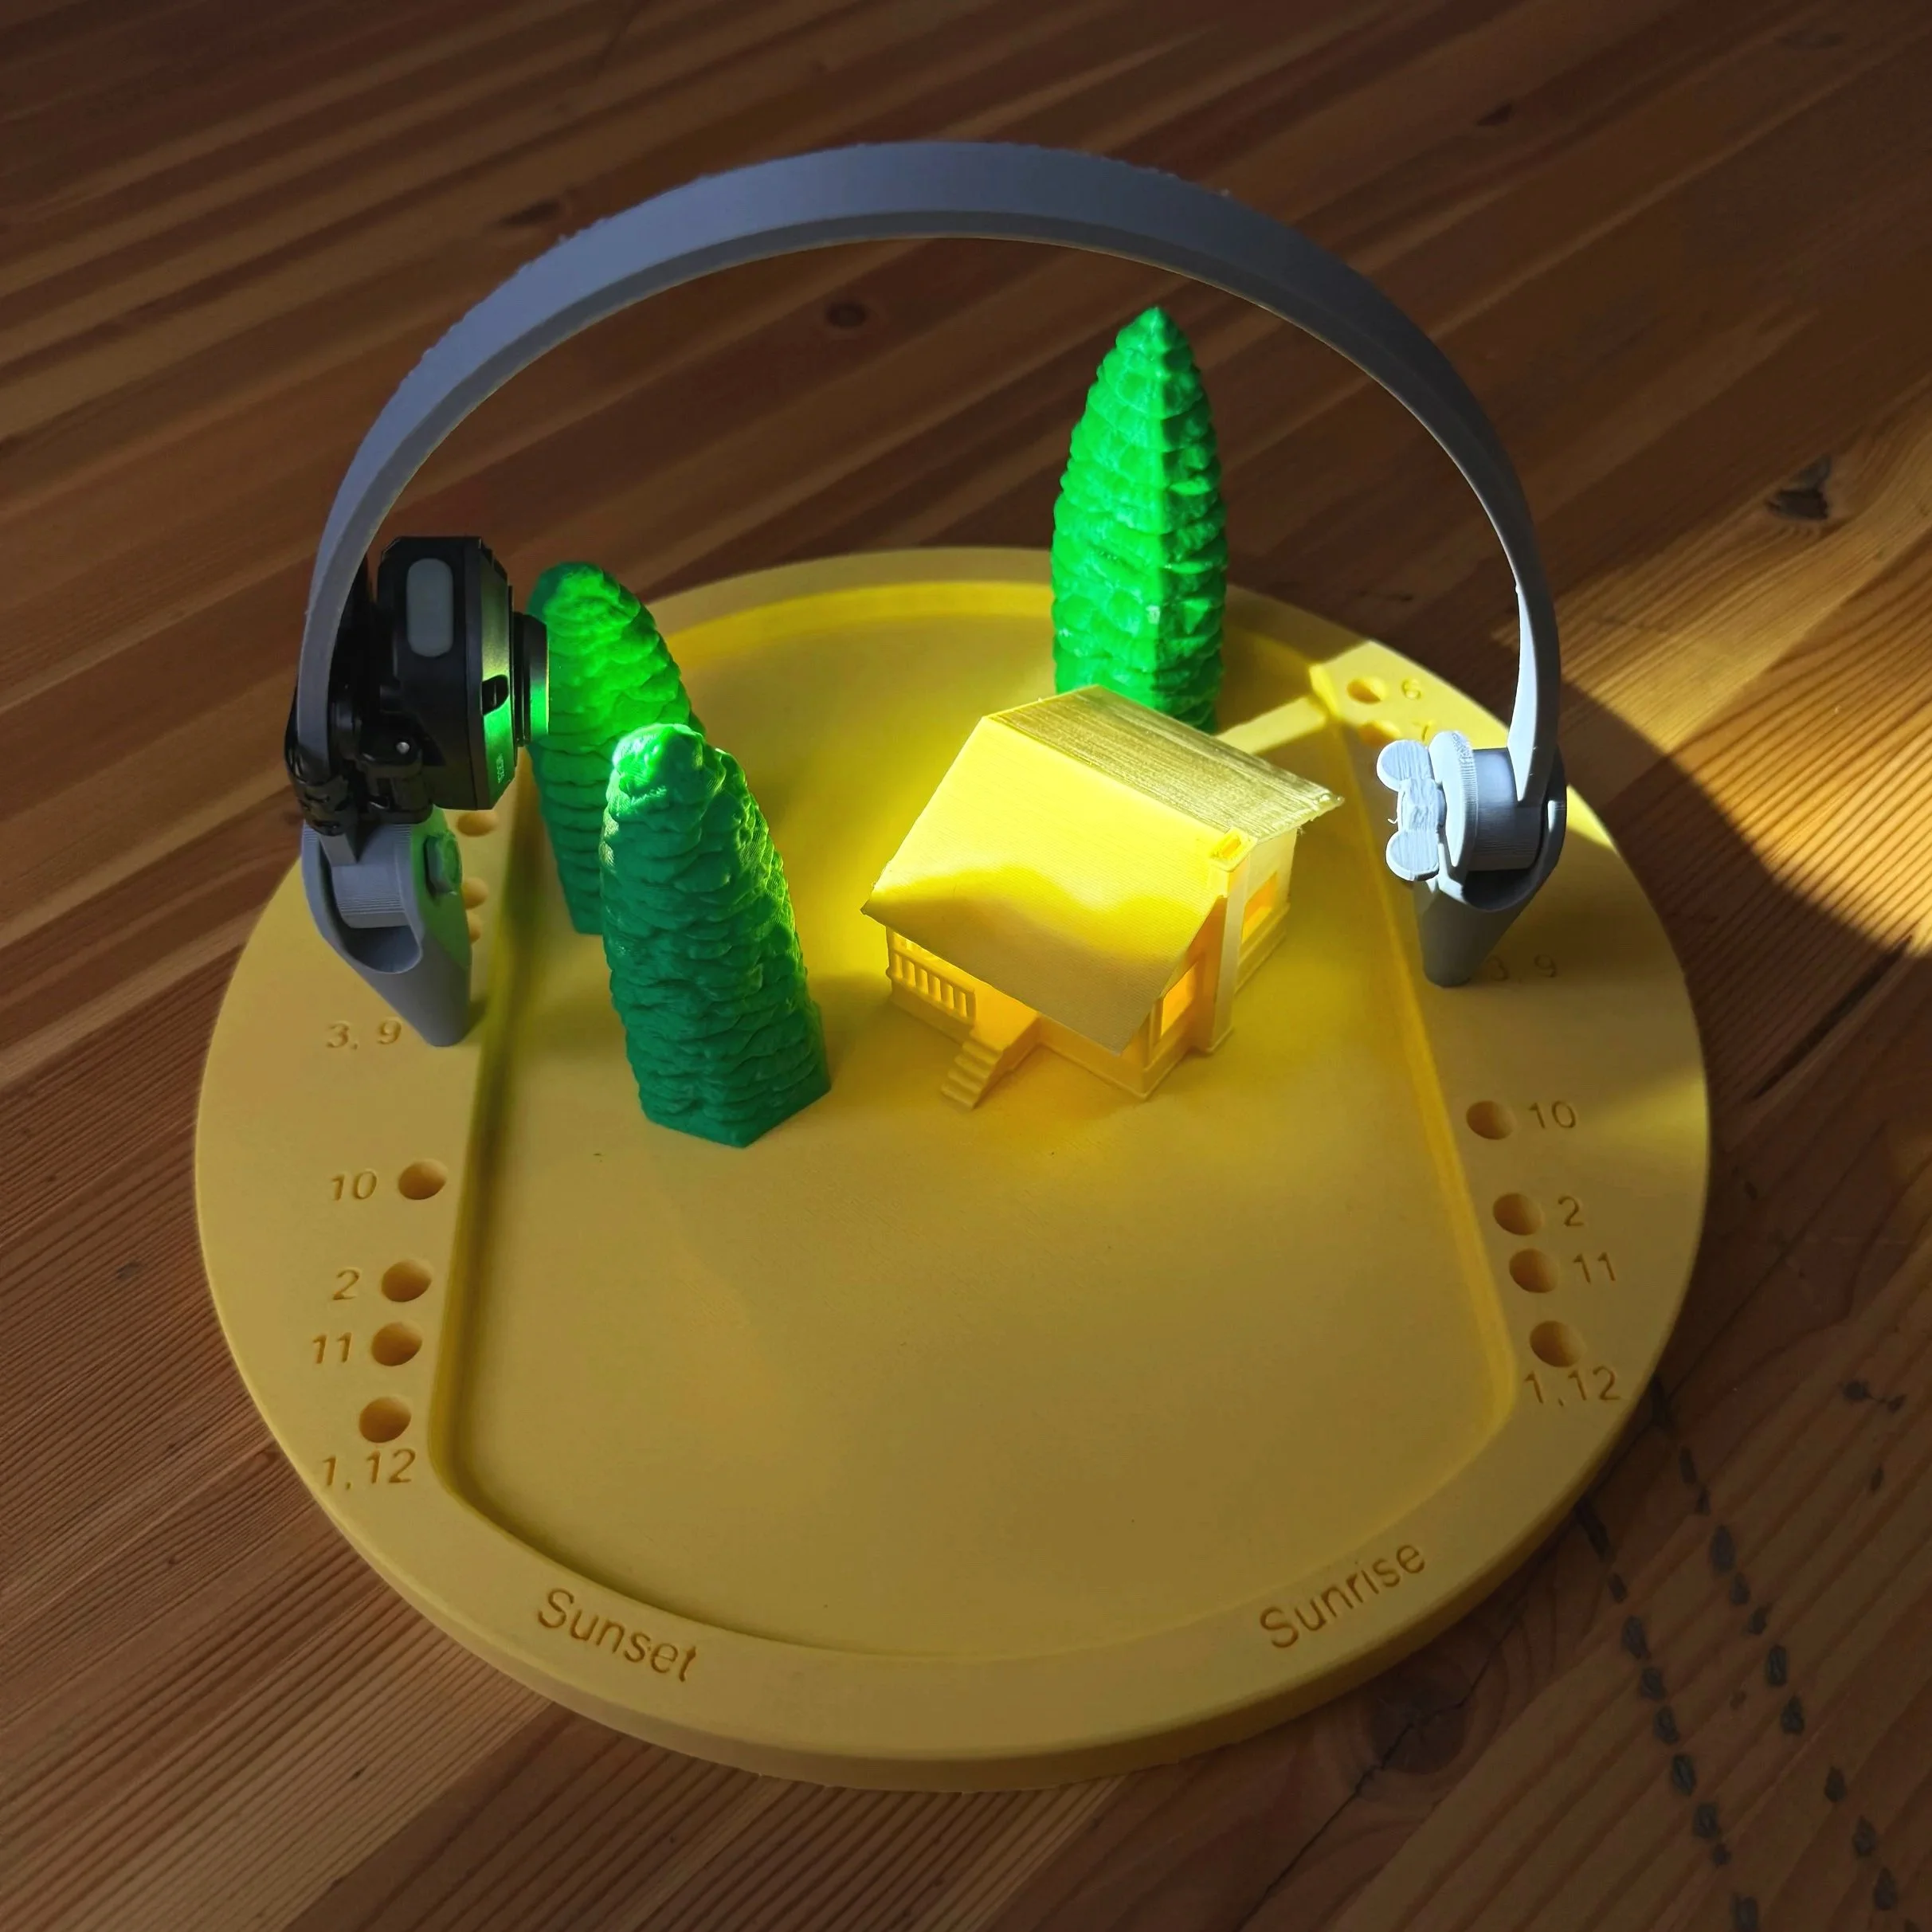
Working in the solar industry in the Pacific Northwest, questions about how seasonal sun and tree shading affect solar panel production are very common.
As a visual thinker, my answers typically come in the form of visual solutions. I created an interactive apparatus to bring to shows and expos that provided clarity surrounding specific properties.
Inspired by…
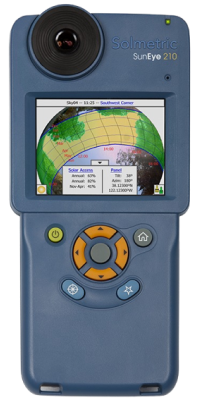
The Solmetric SunEye. This tool takes four things into account when reading the viability of a roof: geographic positioning on the planet, roof azimuth (what direction the slope is facing), the pitch of the roof, and shading. From these four factors, the Suneye calculates TSRF (total solar resource fraction) in the form of a percentage. For example, 100% TSRF in the Puget Sound area would entail a shade-free south-facing roof at a 30º angle. Most houses I see hover between 70-85%.
In the image on the right, the yellow stripe shows the path of the sun for each month of the year (horizontal lines), the sun’s placement for each hour of the day (vertical lines), and the shading (green within the yellow).
All of this to say, the monthly path of the sun and how it impacts production can be arduous to describe to homeowners in two dimensions.
How It Works
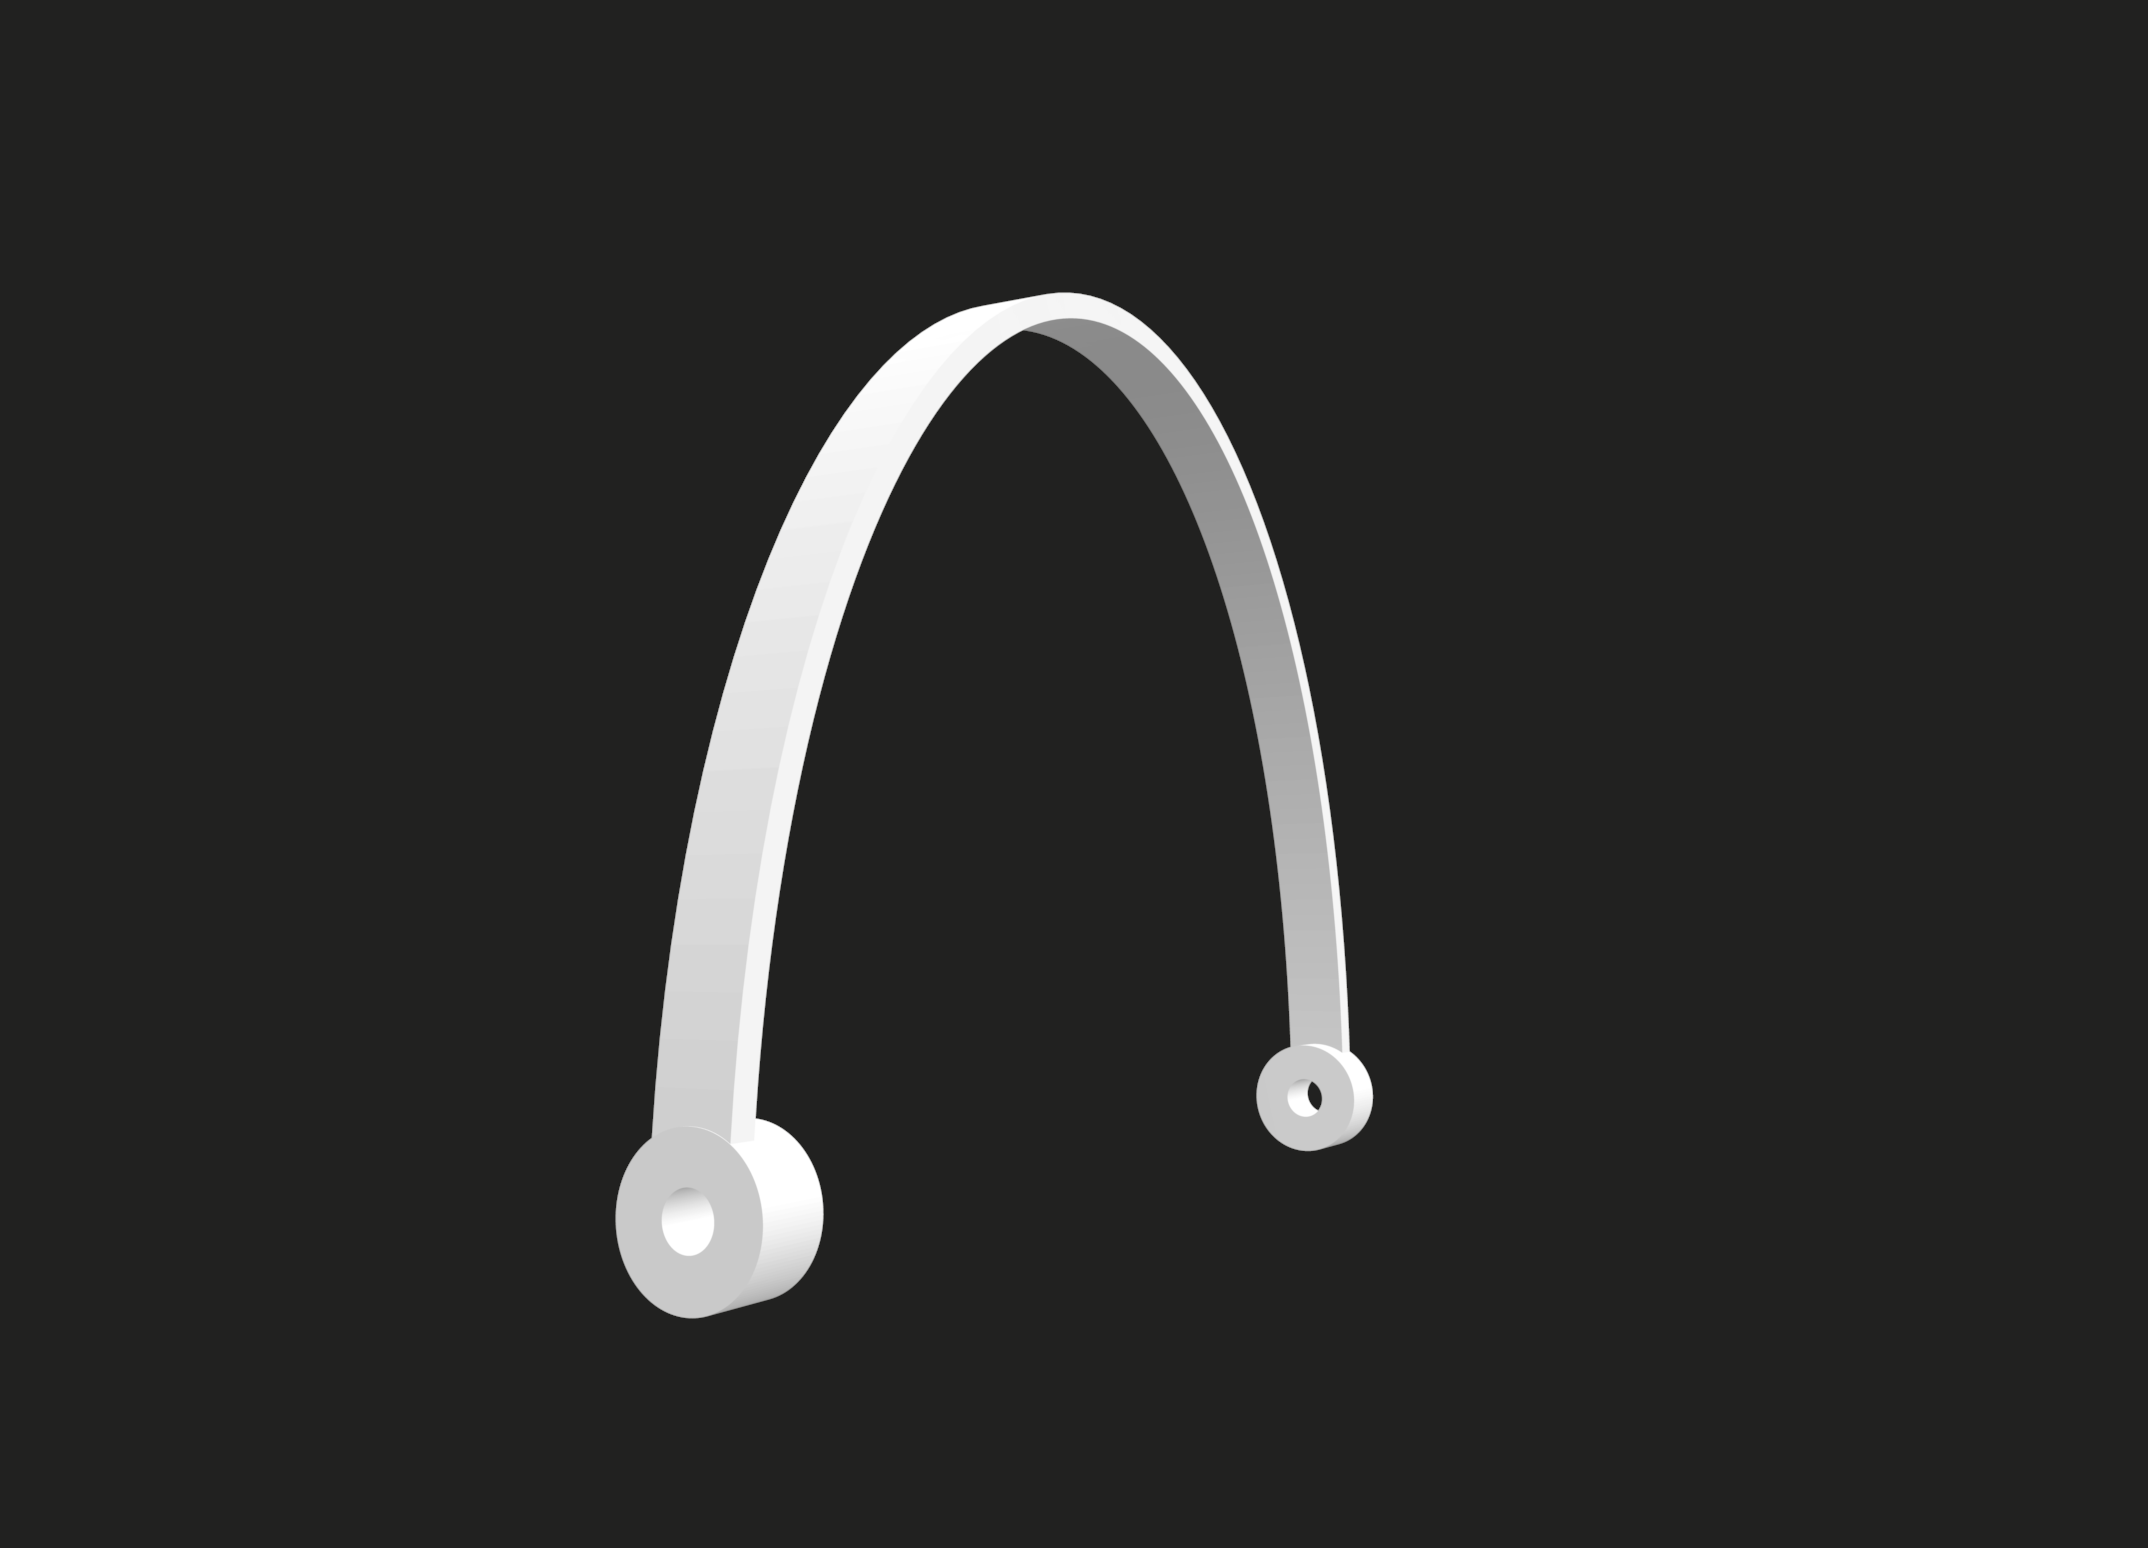
Sun Path Band:
Light acts as the sun, sliding from sunrise to sunset.
A janky headlamp was used for the prototype.
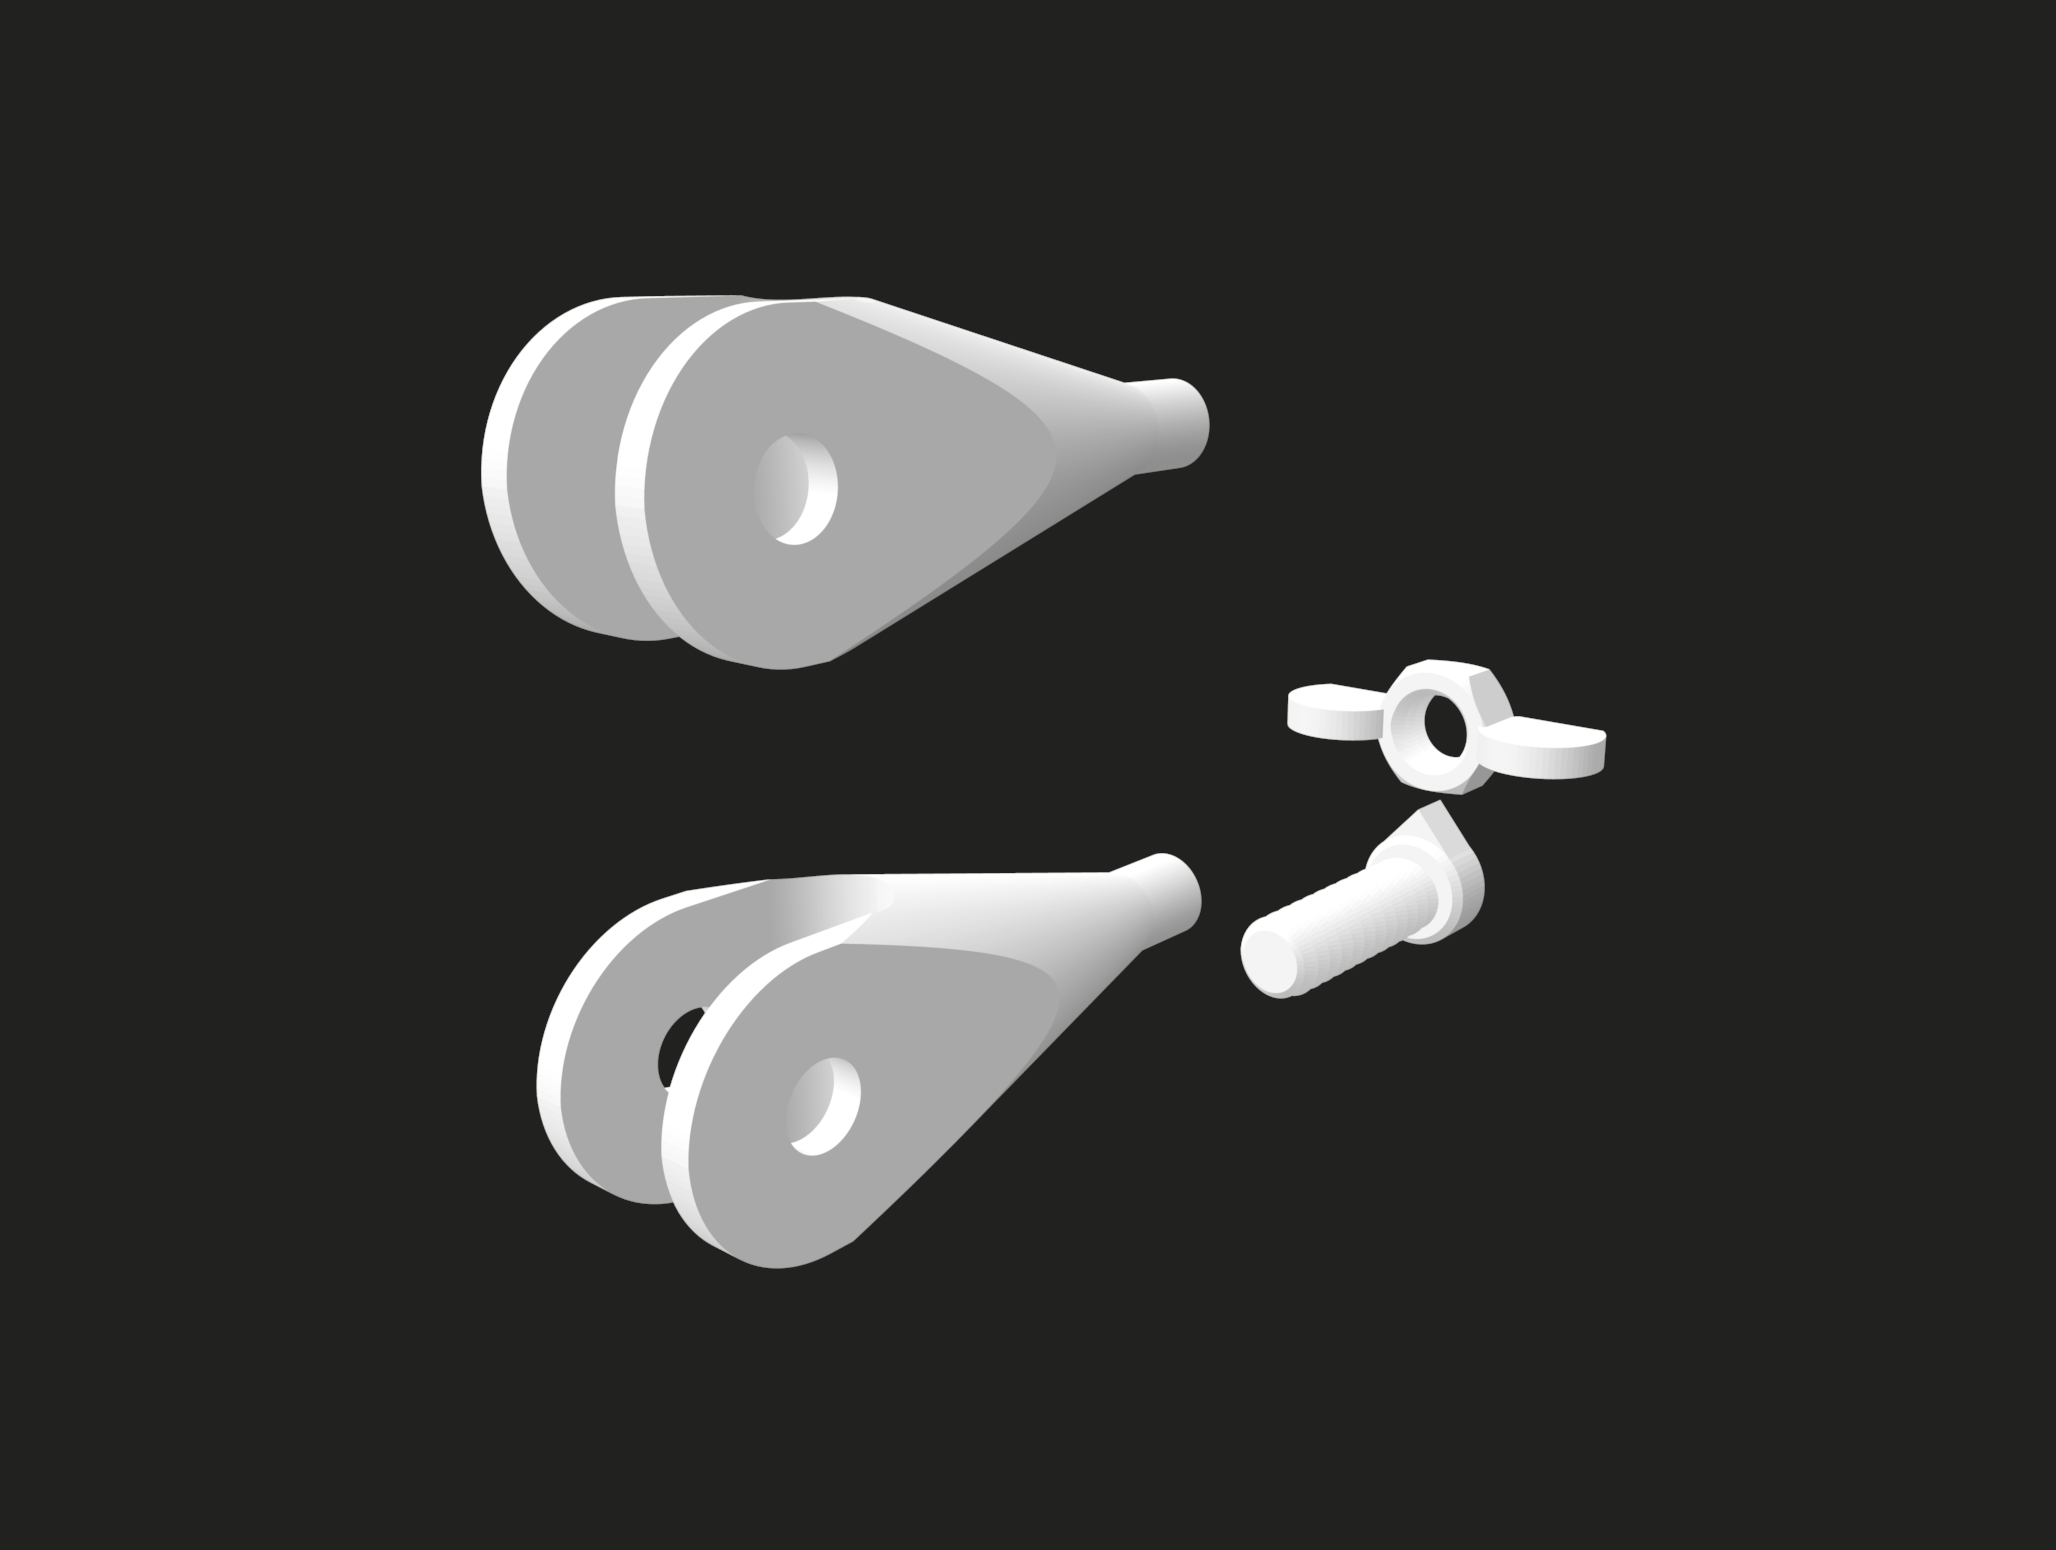
Month/Azimuth Pegs:
Allows band to tilt to lower angles for winter months and higher angles for summer months.
Band can be moved between months.
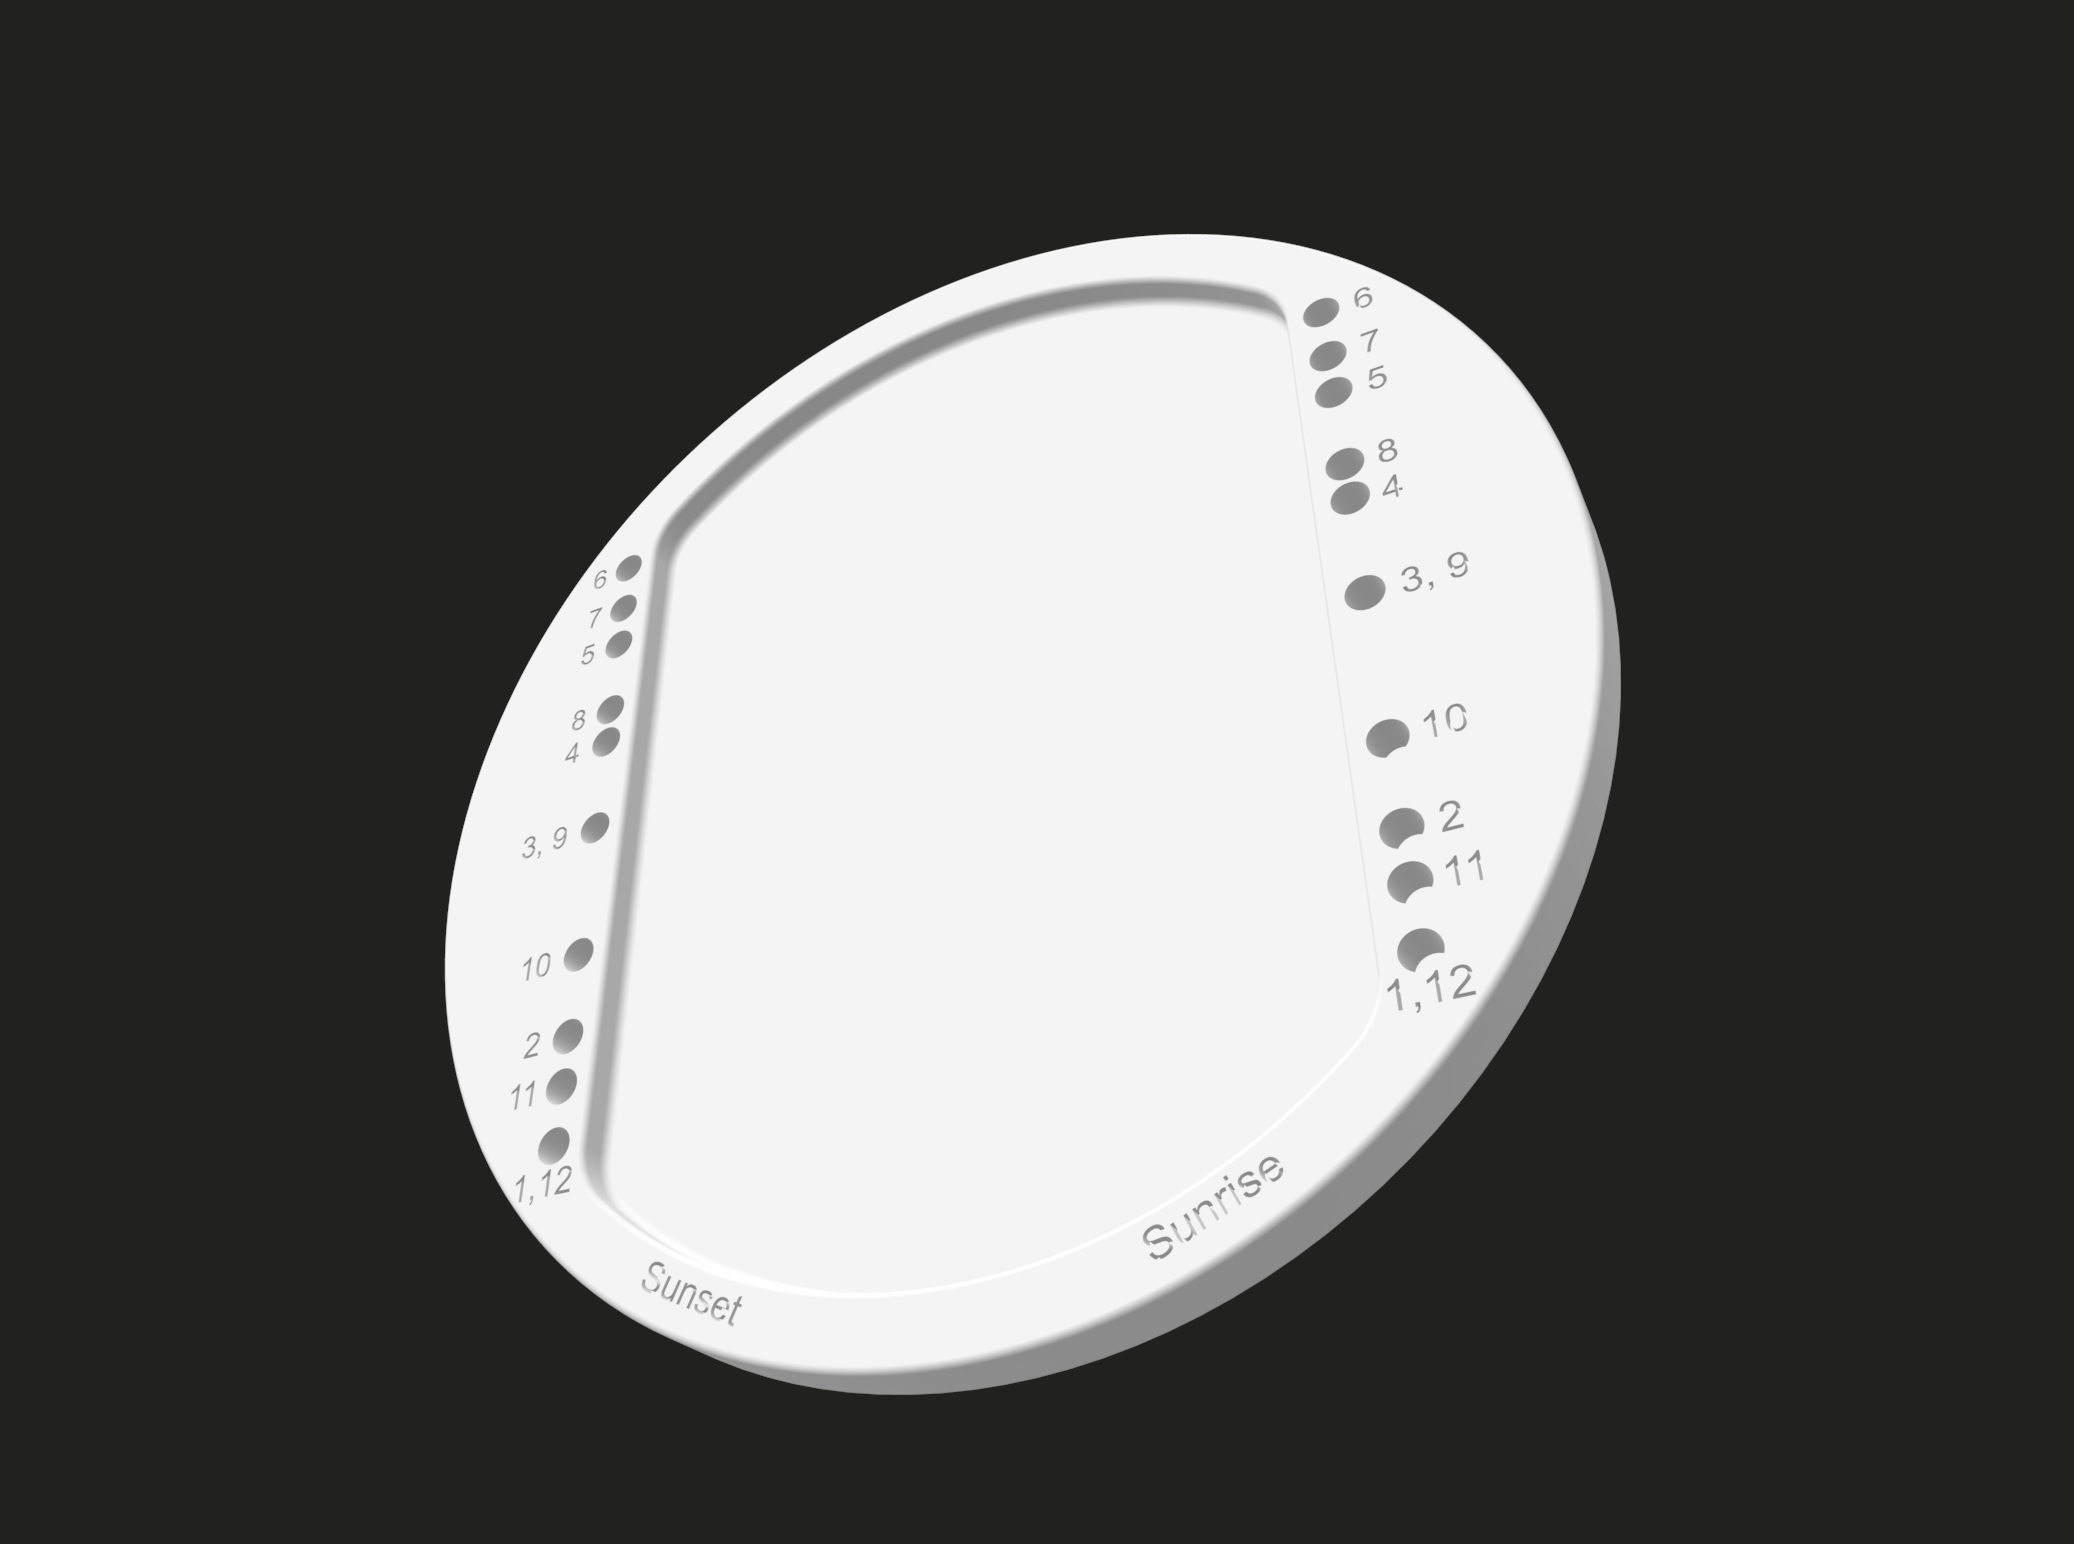
Platform:
Pegs plug into the month (labeled 1-12, representing sunrise/sunset position).
House and trees can be positioned according to roof azimuth and tree shading to visualize solar production.
-
Usability testing, physical product design, Shapr3D, rapid prototyping, 3D printing, and solar performance testing.
-
With this being such a low fidelity prototype, there are three elements I would change if a high fidelity prototype was produced:
The light sliding mechanism: The edge was very rough owing to the fact that my PLA filament did not like the shape of the band. I had to use ABS, and it’s very difficult to make smooth after supports are peeled off. That said, I had to make the design as simple as possible. In a perfect world, I’d make a track across the band that the light can slide along and clamp down or click into a set angle. This would be much more intuitive and user-friendly.
Azimuth pegs: The original mockup had angle readings of the sun’s azimuth for each month of the year. The numbers were so small that the 3D printer didn’t pick up on them. In a higher fidelity prototype, I would have made larger lateral discs with a dial correlated to each month.
Band-to-peg attachment: After interacting with the prototype, I realized it would be ideal to have one side have one secure attachment that would move with the adjustable dial on the other side. The adjustable dial would allow the user to pick the month and corresponding angle of the sun.